
Presenting data and concepts on slides can get boring and monotonous. Given that our generation learns better and engages more through visuals, professionals often organize and present data in the simplest way possible.
Venn diagrams are created to present the relationships between two or multiple sets of data. This type of visual aid makes it easier to determine similarities and distinctions. Most of the time, presenters use overlapping circles, such as the blank Venn diagram below.
Now, you’re probably thinking to yourself: Have I seen this before? Of course, you have probably spent hours working with Venn diagrams to solve mathematical problems. To non-mathematicians, these circles are used to organize information visually. Don’t worry, you won’t have to deal with Algebra.
Benefits of a Venn Diagram
Venn diagrams are designed to organize information visually. Let’s say you want to compare two or three data sets. You can use Venn diagrams to look for correlations and visualize probabilities of certain events.
We can also use Venn diagrams to help us with our daily life choices. For example, you find yourself choosing between two types of shoes. You can use a Venn diagram to determine what they have in common and how they are different.
Now that we know how Venn diagrams are essential in visualizing the relationship between sets of data, let us explore some Venn diagram templates.
Types of Venn Diagrams
We understand that you are not quite familiar with editable Venn diagrams. That’s why you’re here. But to give you a background, there are more than 30 symbols used to determine sets of data. However, we will only discuss the basics.
1. Two-Circle Venn Diagram Template
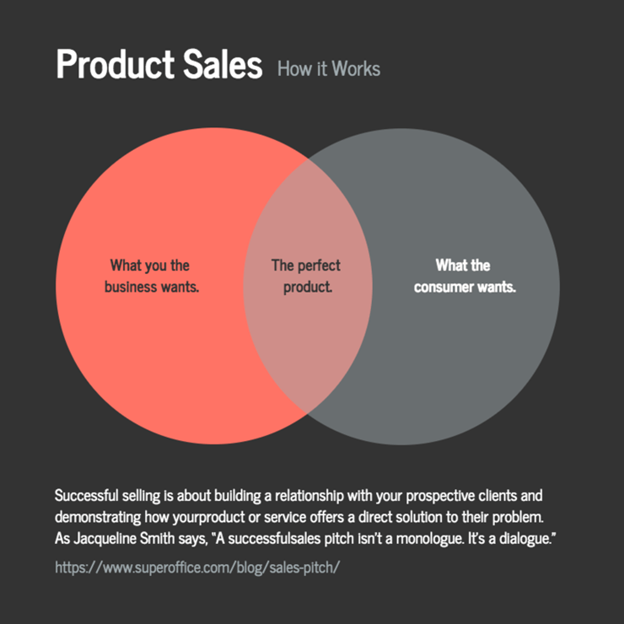
A two-circle Venn diagram template helps your audience identify shared features of two objects. In the template above, Venngage’s template tells two different versions of the same story. Moreover, you can see that the business and the consumer share the same problem: what they WANT.
Where the circles overlap, it tells the possible outcome or the shared characteristics of both parties.
2. Three-Circle Venn Diagram
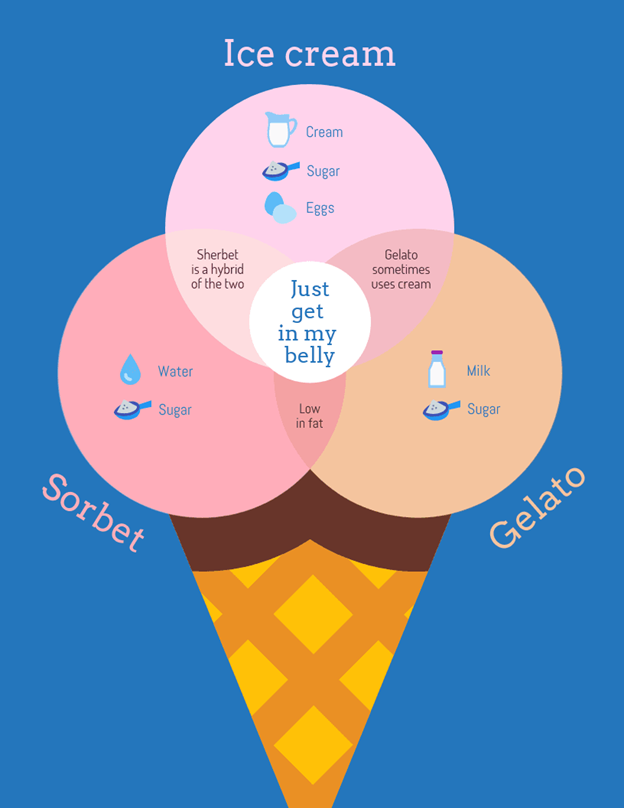
The three-circle Venn diagram above compares three desserts — ice cream, gelato and sorbet. It shows that each dessert shares a common ingredient or quality with another. Ice cream may be combined with sorbet to create sherbet. Ice cream also uses cream like gelato at times. Both gelato and sorbet are low in fat.
All three have one thing in common — they all get in your stomach. This commonality goes into the circle in the middle, which overlaps the three bigger circles. In other words, the Venn diagram shows the commonalities, differences and relations among things or groups of things.
3. Four-Circle Venn Diagram
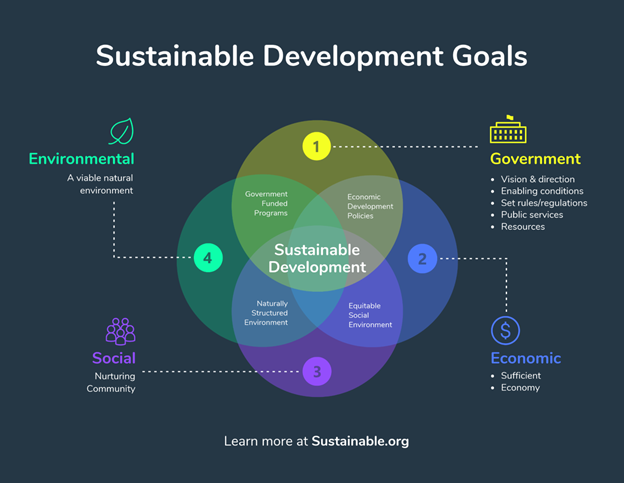
To determine the relationship between four objects, you can use an editable four-circle Venn diagram like the example above. This more complex diagram shows that each of the four targets aim for the same goal: sustainable development. Yet, you can see that the diagram does not show all possible interactions of the four objects.
You can also get creative with your diagrams by using ovals or ellipses instead of circles. It can be a great alternative to identify four circular sets of values with similar elements among them. In conclusion, this type of editable Venn diagram easily compares ideas and makes decision-making effortless.
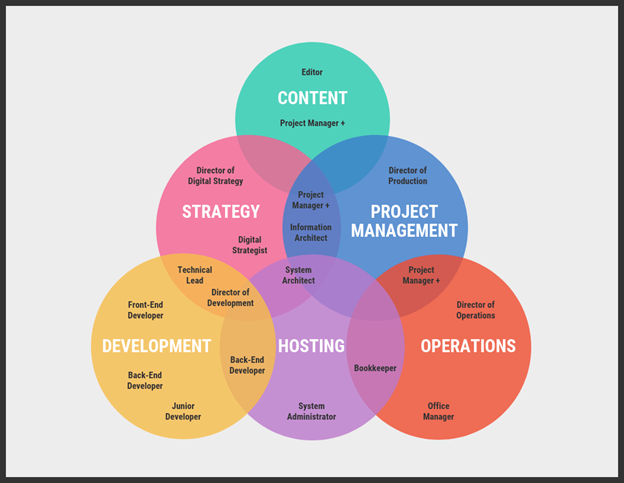
4. Five-Circle Venn Diagram
For this example, the five-circle Venn diagram comprises five circles, ovals, or curves. This five-set diagram can pair a three-circle diagram with a recursive curve. However, you must think twice and be careful not to overplay: too many ingredients can spoil a meal. Having said that, too many circles can hurt the Venn diagram and create confusion for your audience.
But if your intuition tells you to use a five-circle Venn diagram, it’s a green light from us. Venngage has templates to simplify the process.
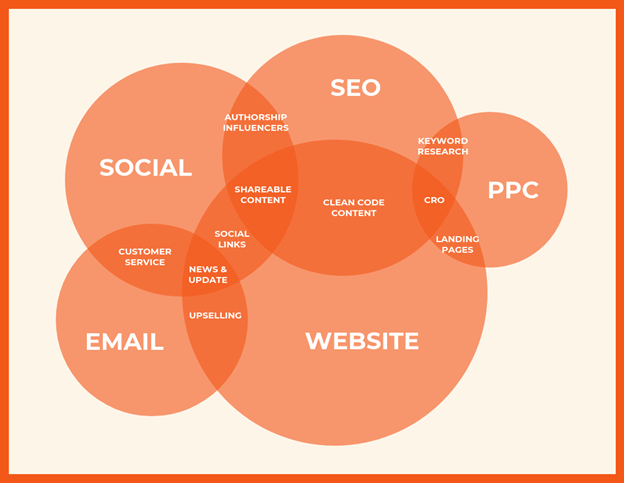
5. Six-Circle Venn Diagram
Yes, it can also get complicated with the six-circle Venn diagram. This is the part where you can say that Venn diagrams are not just a bunch of interlocking circles. This type of diagram becomes handy if you’re trying to express data with six categories in circles, ovals, or curves.
You can edit the circles into the multi-layered, arcing, or mixed design if you want a different approach to the six-circle Venn diagram. One style can sometimes be not enough with the type of complex data you have in mind. So, if you want an example of what we mean, take a look at this Venn diagram with six circles.
These are only some of the Venn diagrams. You can still choose from hundreds of templates for corporate, creative, and social use. When it comes to Venngage’s tools, you can also include icons and images to make your presentation more engaging — presenting graphs and diagrams can make your audience yawn sometimes. When it comes to color coding, the website already has everything prepared and regions where intersections should be shaded. v